Economic predictions are a hard thing to do and a work in progress for me. I’ve been doing them for some time on my annual forecasts but of course, the proof of the pudding is always in the eating. Of late, I’ve been attempting to forecast pricing with greater accuracy. 16 May 2017, I started posting about the price of oil on my Facebook account.
The first post was as follows:
“Market watch for 2017. Based on 2017’s annual chart (which officially will start to slide into influence this month of 巳 May 2017), we will see definite movement to the price of oil. This development with Opec however may not actually come to fruition until much later in the year. This is because Rooster is Metal but we are now officially entering the Fire Season. Specifically this year’s remaining two Fire months are very strong – 丙午 followed by 丁未.
Thus, my forecast for oil prices in 2017 will be a bump up this month but one that doesn’t last – it will be followed by two months of decline (possibly due to shale or some problems getting all the OPEC members on board or all the oil producers on board) but we should see things actually start to kick in in terms of an increase in oil price only in August and September 2017…with a likely peak in January 2018 as Metal reaches its pinnacle in that month. I’m no oil trader but I’m guessing (operative word, guessing) 2-5 dollars up in May, and a healthy 10-15 dollar jump in Q3…now…let’s see what the Rooster brings…”
June 5th, I posted on facebook as follows:
“The oil price story continues to follow the elemental trend. Moving into 丙午and 丁未 we will continue to see pressure on oil prices after some bounce from good news in May due to the presence of the 庚 inside 巳 – the adventurous may consider taking positions in time for the surge of the Rooster in August/September 2017. “
Here are three key oil charts from Bloomberg: (click to ENLARGE)
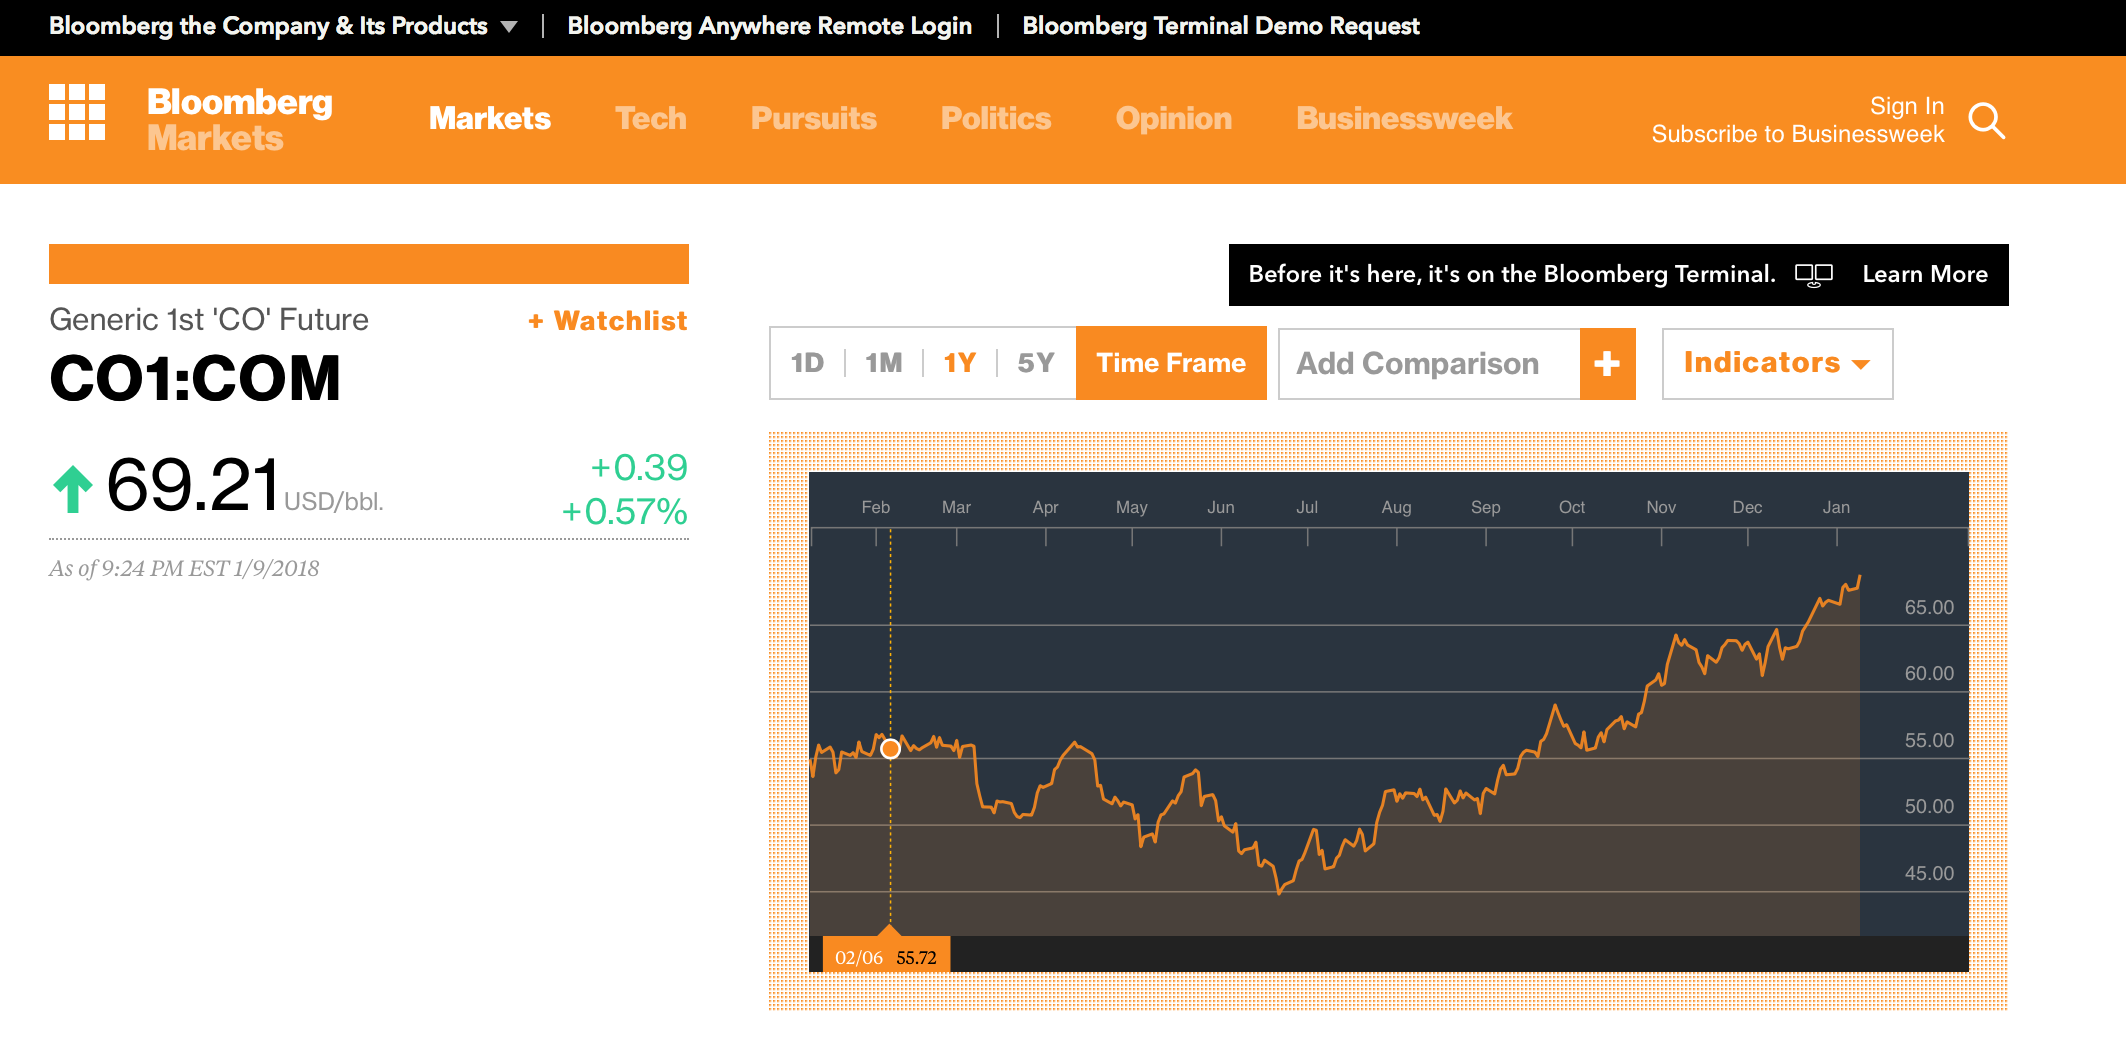
Brent Crude Feb2017
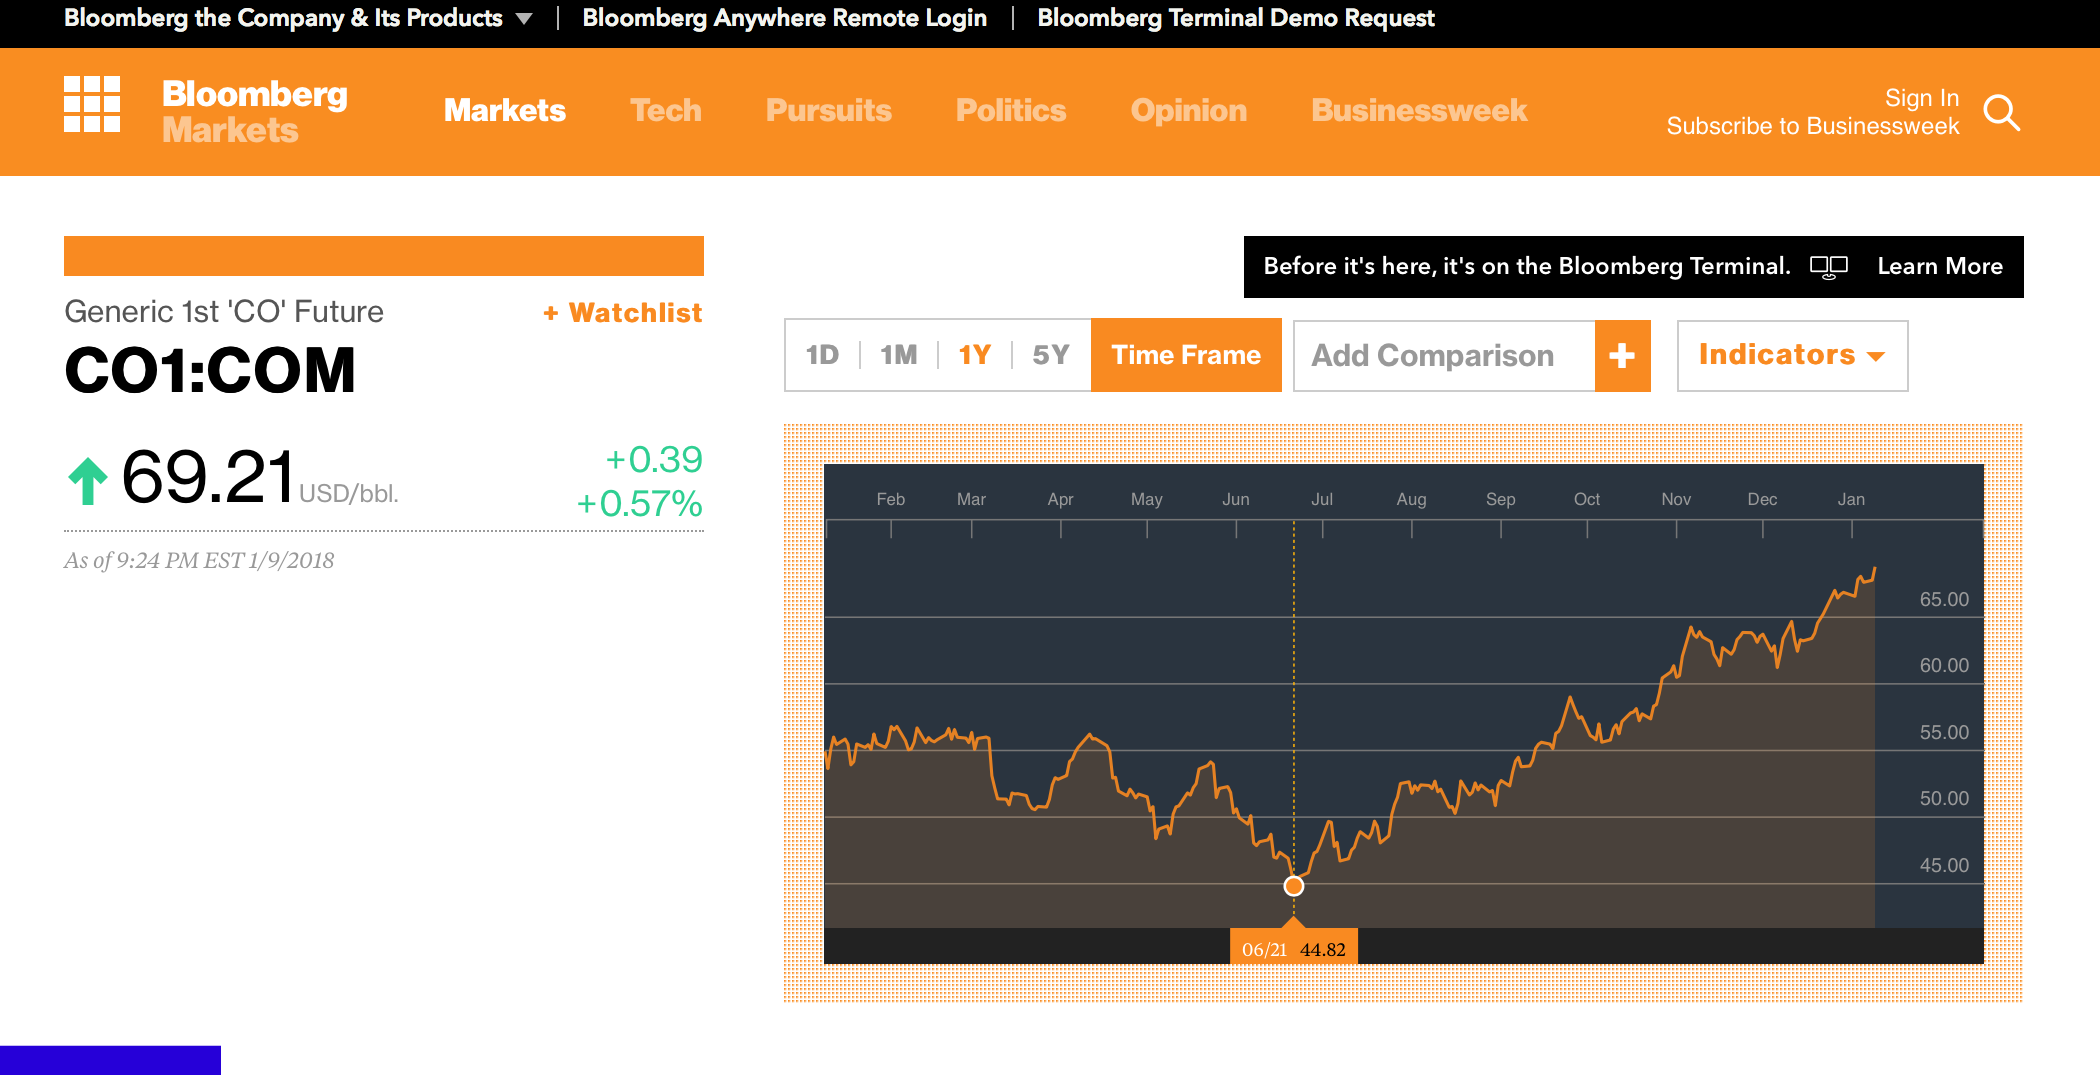
Brent Crude June 2017
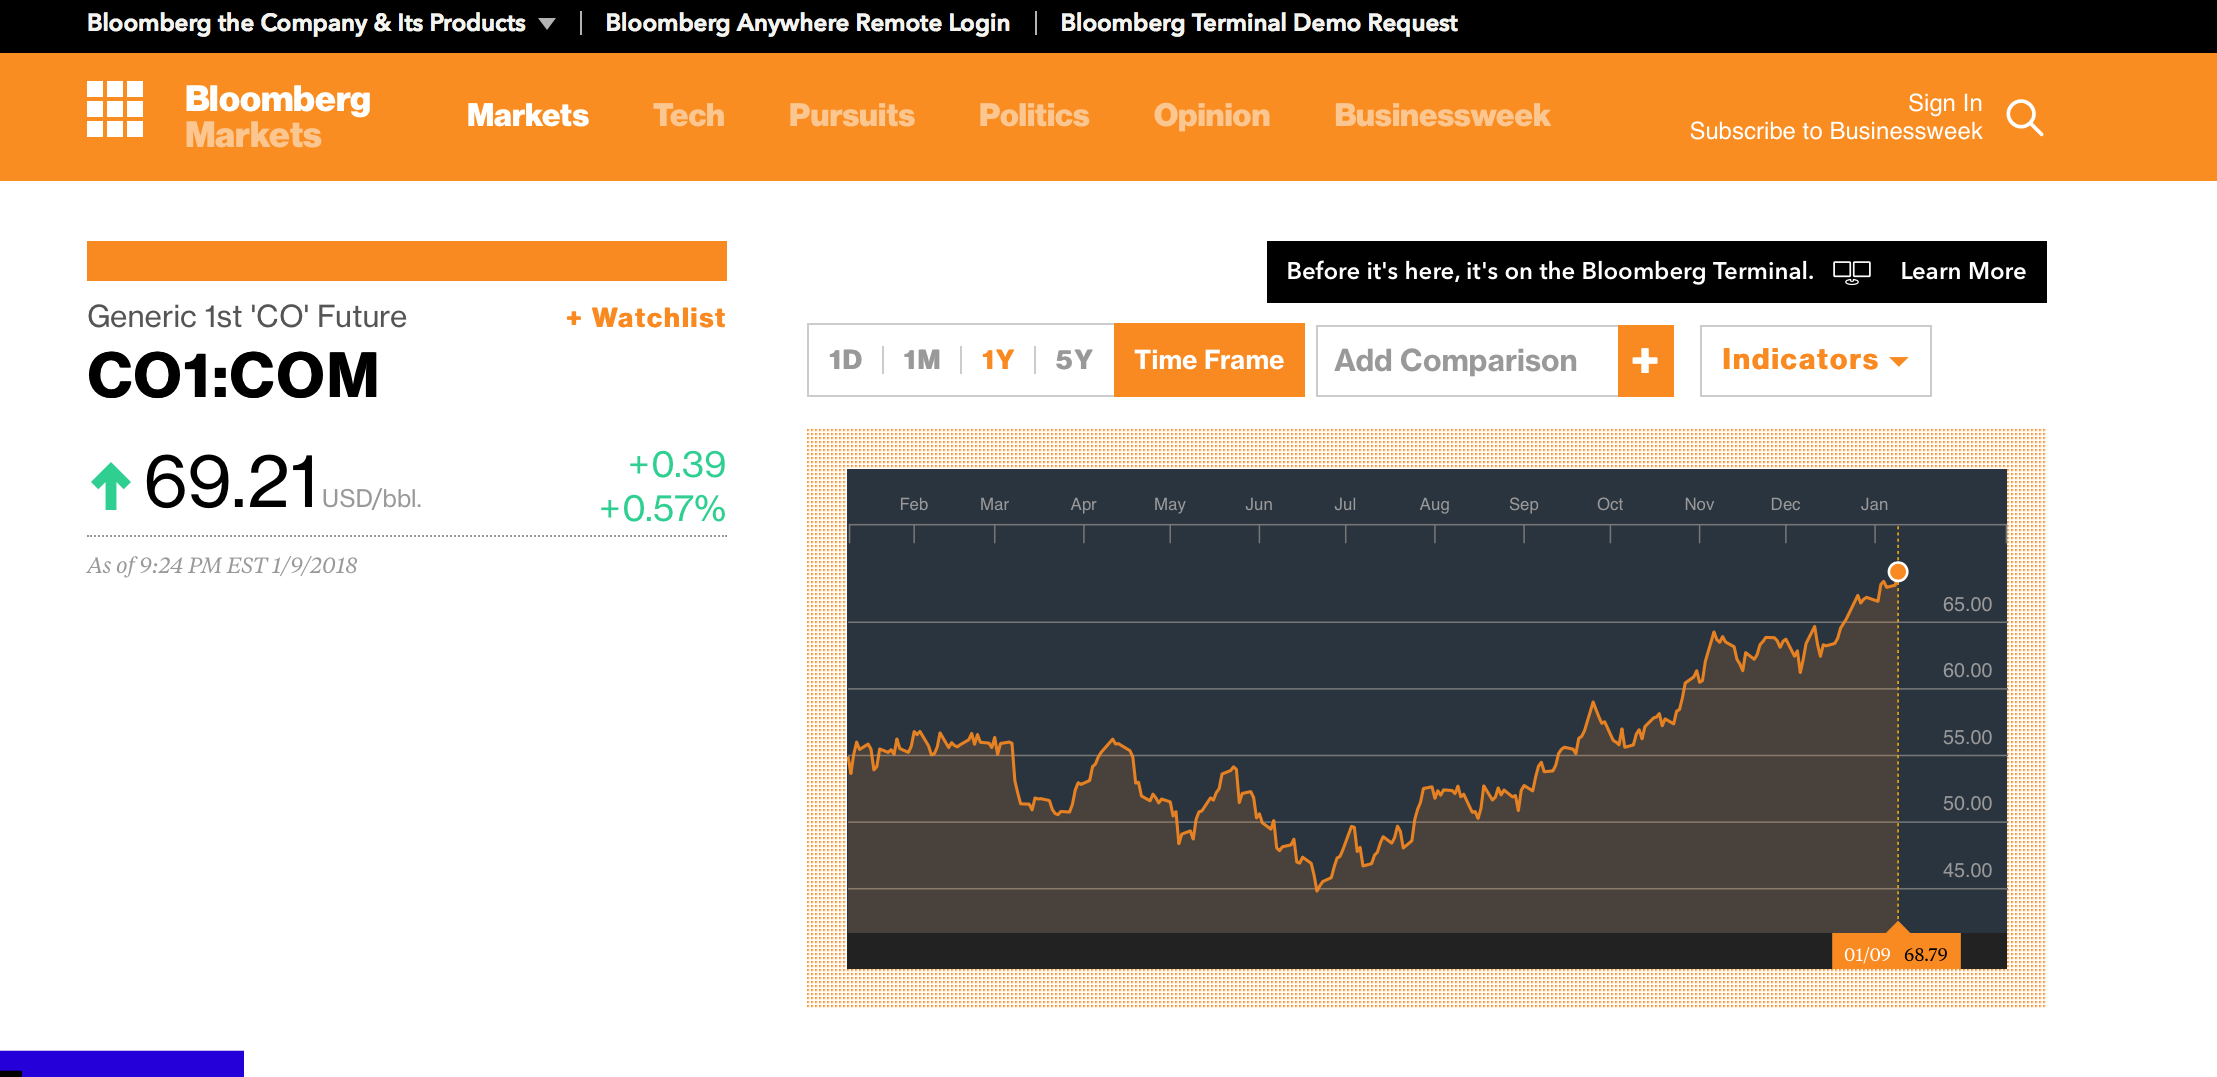
Brent Crude Jan 2018
Here are the key numbers:
Opening price during Feb 2017: 55.72
Lowest price for 2017: 44.82 (June 2017)
Highest price to date for 2017 (arguably tbd as 2017 not over yet): 69.21
The difference is approximately +13.49 between opening and highest, and +24.39 between lowest and highest.
June was 丙午 in 2017, when summer is as it’s peak, and thus, strong competition for oil, which is represented by Fire.
As we can see from the Bloomberg crude oil charts, there is a very clear upswing past the month of June with a clear upward trend in September (which is when oil) surpassed it’s original start of the year price. The dip in October is expected (Metal enters graveyard – metal is the wealth of fire, which represents energy/oil). The solid build towards January 2018 is expected because the energy of Rooster is FINALLY kicking in and peaking. And we could actually see more peaks coming with one last push in May 2018 or even, the energy continuing to peak in September 2018 before Rooster gives way to the Dog.
I often get questions about whether this is ascending and descending Qi in operation. For full disclosure, I know nothing about that technique (so don’t ask me about it)
Instead, what I am looking at is two very simple things things:
a) elemental combinations – it’s all about the frame people.
b) the base chart of the year, in this case, 2017, which shows strong Metal
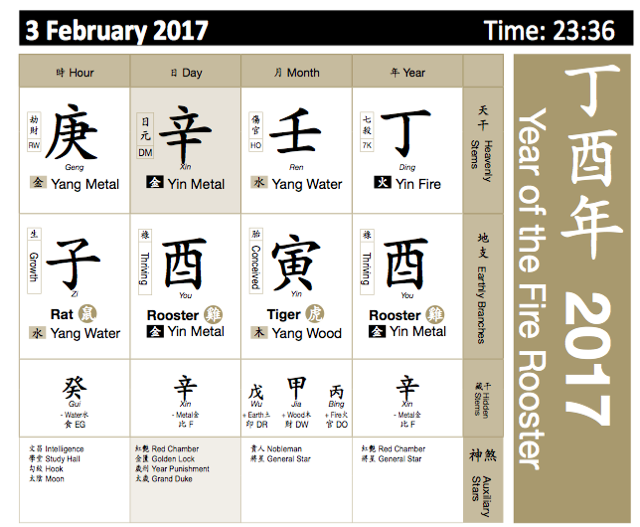
Ding You 2017 BaZi chart
The assumption that every year kicks in exactly on Feb 4th is not the case. Observers of metaphysics both feng Shui and BaZi know that the energies don’t always move so consistently. In this case, we had a late kick in for Rooster (see this blog entry on why the kick in for Rooster is delayed)
Back to my forecast – I wrote:
I’m no oil trader but I’m guessing (operative word, guessing) 2-5 dollars up in May, and a healthy 10-15 dollar jump in Q3…now…let’s see what the Rooster brings…”
On 16 May 2017, the price of oil, using Bloomberg’s Crude Oil price graph, was 51.65. The peak price in May was 53.87. So 2 dollar jump was reasonably accurate although if we use the lowest price for May 2017, which was 49.10 on 4th of May, then there was about a 5 dollar jump. I’m happy with this band estimate. The band estimate was based on the fact that May is more a transit from Monkey to Rooster, rather than Rooster in itself.
On Sept 25, 2017, Brent Crude oil hit 59 dollars. That put it some 14 dollars above the lowest price in June 2017 of 44.82. My forecast was therefore correct (timing and price wise) based on the absolute low of 44.82 in June 2017. However, it can also be argued that this forecast was incorrect since at the time of writing, I didn’t estimate how low it would go during this summer months.
However, I am pleased to note that my overall forecast with regards oil prices moving up by up by 15 dollars and beyond was supported by actual price and market movements. There were many naysayers I met who insisted the price of oil would never go up. Now, can I accurately predict when the price of oil will go down in 2018?
Stay tuned.


0 Comments